
September 29, 2020 at 03:18PM


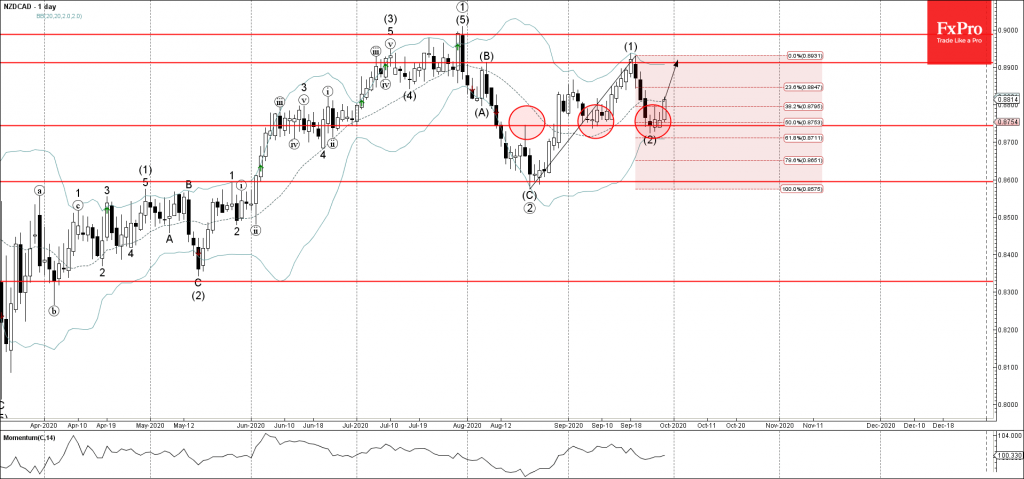
• NZDCAD reversed from support area
• Likely to rise to 0.8900
NZDCAD recently reversed up from the support area located between the pivotal support level 0.8745 (which has been reversing the price from the middle of August), lower daily Bollinger Band and the 50% Fibonacci retracement of the upward impulse (1) from last month.
The upward reversal from this support area stopped the previous medium-term ABC correction (2).
NZDCAD is likely to rise further toward the next resistance level 0.8900 (top of the previous medium-term impulse wave (1)).
From: The FxPro Tech Analysis Team https://fxpro.news/market-snapshots/nzdcad-wave-analysis-29-september-2020-20200929/
Selected by fonecable.com

Search Web: NZDCAD Wave Analysis 29 September, 2020
Recent Posts
- Crude Oil Over Crypto
- US Dollar Price Action Setups pre-CPI: EUR/USD, GBP/USD, USD/JPY
- Cathie Wood & Ark: Insiders Aren’t Buying the Hype
- Breaking News: ECB Holds Rates, Setting up July and September for Fireworks
- Currency Carry Trade: What is it and how does it work?
Happy
0 %
Sad
0 %
Excited
0 %
Sleepy
0 %
Angry
0 %
Surprise
0 %


Average Rating