
October 08, 2020 at 03:47PM


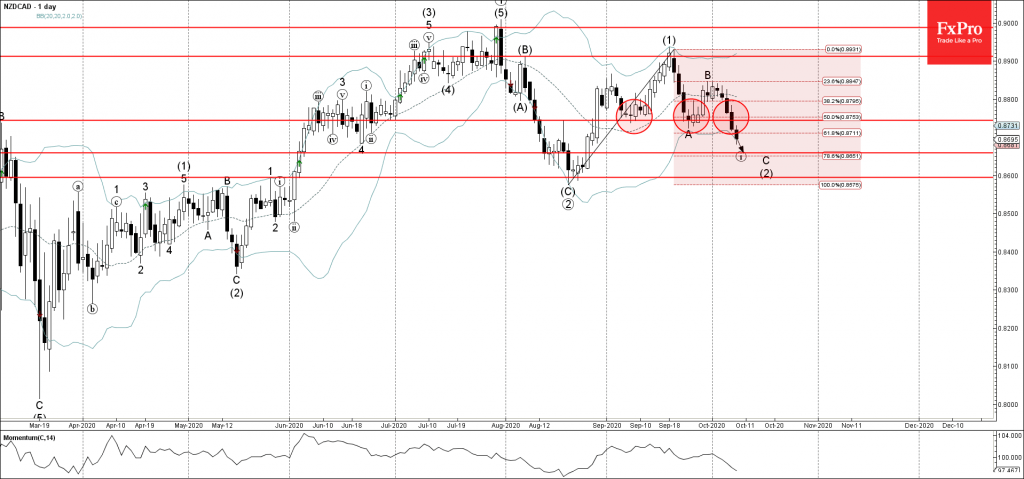
• NZDCAD broke support zone
• Likely to fall to 0.8660
NZDCAD recently broke the support zone lying between the key support level 0.8750 and the 50% Fibonacci correction of the upward impulse wave (1) from August.
The breakout of this support zone accelerated the active downward impulse wave C of the ABC correction (2) from last month.
NZDCAD is likely to fall further toward the next support level 0.8660 (target price for the completion of the active sub-impulse wave (i)).
From: The FxPro Tech Analysis Team https://fxpro.news/market-snapshots/nzdcad-wave-analysis-8-october-2020-20201008/
Selected by fonecable.com

Search Web: NZDCAD Wave Analysis 8 October, 2020
Recent Posts
- Crude Oil Over Crypto
- US Dollar Price Action Setups pre-CPI: EUR/USD, GBP/USD, USD/JPY
- Cathie Wood & Ark: Insiders Aren’t Buying the Hype
- Breaking News: ECB Holds Rates, Setting up July and September for Fireworks
- Currency Carry Trade: What is it and how does it work?
Happy
0 %
Sad
0 %
Excited
0 %
Sleepy
0 %
Angry
0 %
Surprise
0 %


Average Rating