
October 26, 2020 at 03:21PM


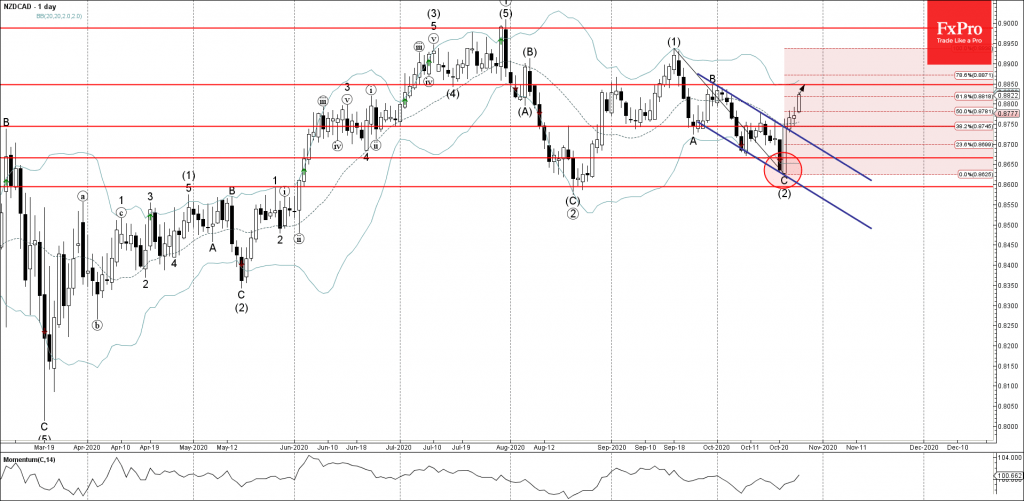
• NZDCAD rising inside impulse wave (3)
• Likely to rise to 0.8850
NZDCAD continues to rise inside the medium-term impulse wave (3) which started earlier from the support area lying between the support levels 0.8600 (former multi-month low from August), lower daily Bollinger band and the support trendline of the daily down channel from September.
The price earlier broke the upper resistance trendline of the aforementioned down channel from September – which accelerated the active impulse wave (3).
NZDCAD is likely to rise further toward the next resistance level 0.8850 (top of the previous minor correction B from the end of September).
From: The FxPro Tech Analysis Team https://fxpro.news/market-snapshots/nzdcad-wave-analysis-26-october-2020-20201026/
Selected by fonecable.com

Search Web: NZDCAD Wave Analysis 26 October, 2020
Recent Posts
- Crude Oil Over Crypto
- US Dollar Price Action Setups pre-CPI: EUR/USD, GBP/USD, USD/JPY
- Cathie Wood & Ark: Insiders Aren’t Buying the Hype
- Breaking News: ECB Holds Rates, Setting up July and September for Fireworks
- Currency Carry Trade: What is it and how does it work?


Average Rating