
January 13, 2021 at 03:38PM


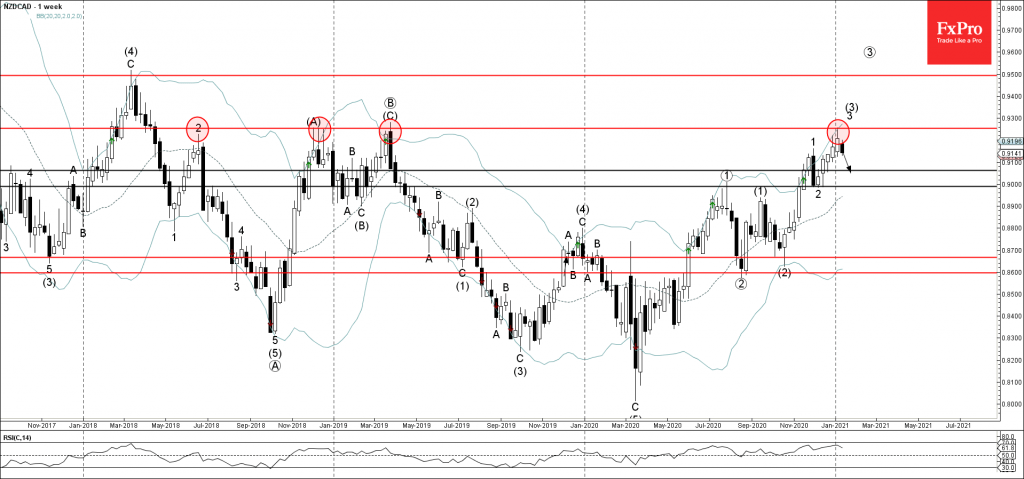
• NZDCAD reversed from resistance area
• Likely to fall to 0.9060
NZDCAD recently reversed down from the powerful resistance area lying between the long-term resistance level 0.9255 (which has been reversing the price from the middle of 2018) and the upper weekly Bollinger Band.
The downward reversal from this resistance area stopped the earlier two weekly upward impulse waves 3 and (3).
Given the strength of the aforementioned resistance area NZDCAD is likely to fall further toward the next support level 0.9060.\
From: The FxPro Tech Analysis Team https://fxpro.news/market-snapshots/nzdcad-wave-analysis-13-january-2021-20210113/
Selected by fonecable.com

Search Web: NZDCAD Wave Analysis 13 January, 2021
Recent Posts
- Crude Oil Over Crypto
- US Dollar Price Action Setups pre-CPI: EUR/USD, GBP/USD, USD/JPY
- Cathie Wood & Ark: Insiders Aren’t Buying the Hype
- Breaking News: ECB Holds Rates, Setting up July and September for Fireworks
- Currency Carry Trade: What is it and how does it work?
Happy
0 %
Sad
0 %
Excited
0 %
Sleepy
0 %
Angry
0 %
Surprise
0 %


 Builds for the Next Big Break, BTC/USD Levels")
Average Rating