March 10, 2021 at 03:48PM
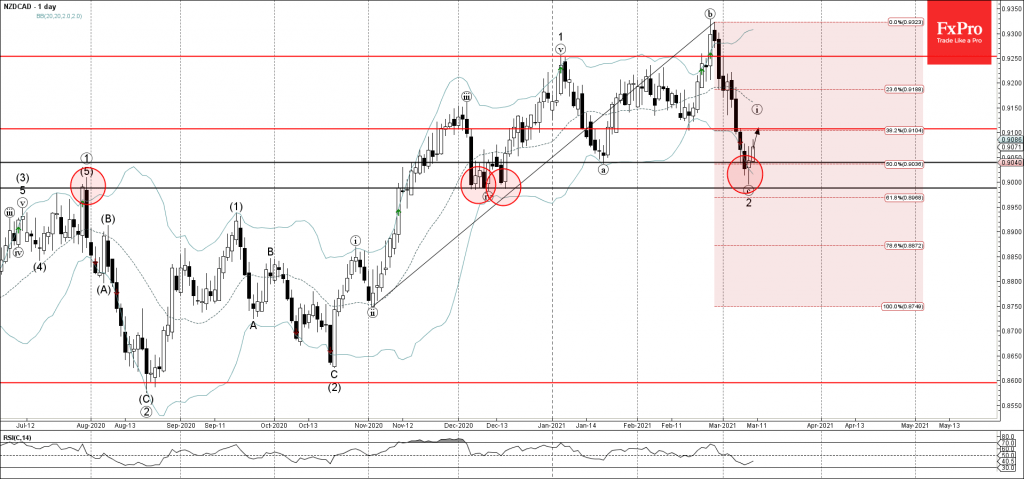
• NZDCAD reversed from support level 0.9000
• Likely to reach resistance level 0.9100
NZDCAD recently reversed up from the round support level 0.9000 (which reversed the pair multiple times in December) – standing outside of the the lower daily Bollinger Band and intersecting with the 61.8% Fibonacci correction of the upward impulse from November.

The upward reversal from the support level 0.9000 started the active short-term impulse wave 3.
NZDCAD is likely to rise further toward the next resistance level 0.9100 (former monthly low from February).
From: The FxPro Tech Analysis Team https://fxpro.news/market-snapshots/nzdcad-wave-analysis-10-march-2021-20210310/
Selected by fonecable.com


Search Web: NZDCAD Wave Analysis 10 March, 2021
Recent Posts
- Crude Oil Over Crypto
- US Dollar Price Action Setups pre-CPI: EUR/USD, GBP/USD, USD/JPY
- Cathie Wood & Ark: Insiders Aren’t Buying the Hype
- Breaking News: ECB Holds Rates, Setting up July and September for Fireworks
- Currency Carry Trade: What is it and how does it work?
Happy
0 %
Sad
0 %
Excited
0 %
Sleepy
0 %
Angry
0 %
Surprise
0 %