
September 17, 2020 at 03:52PM


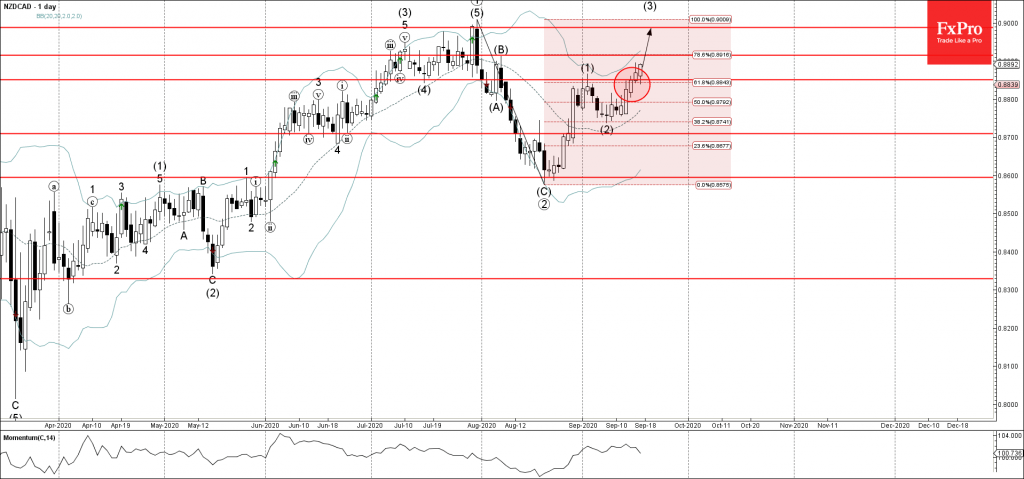
• NZDCAD broke resistance area
• Likely to rise to 0.8915 and 0.9000
NZDCAD recently broke resistance area located between the resistance level 0.8850 (which stopped the previous impulse wave (1)) and the 61.8% Fibonacci correction of the downward correction from July.
The breakout of this resistance area continues the active medium-term impulse wave (3) from the start of September.
NZDCAD is likely to rise further toward the next resistance level 0.8915 (top of wave (B) from the start of August) – the breakout of which can lead to further gains toward the powerful resistance 0.9000.
From: The FxPro Tech Analysis Team https://fxpro.news/market-snapshots/nzdcad-wave-analysis-17-september-2020-20200917/
Selected by fonecable.com

Search Web: NZDCAD Wave Analysis – 17 September, 2020
Recent Posts
- Crude Oil Over Crypto
- US Dollar Price Action Setups pre-CPI: EUR/USD, GBP/USD, USD/JPY
- Cathie Wood & Ark: Insiders Aren’t Buying the Hype
- Breaking News: ECB Holds Rates, Setting up July and September for Fireworks
- Currency Carry Trade: What is it and how does it work?
Happy
0 %
Sad
0 %
Excited
0 %
Sleepy
0 %
Angry
0 %
Surprise
0 %


Average Rating