
December 28, 2020 at 02:58PM


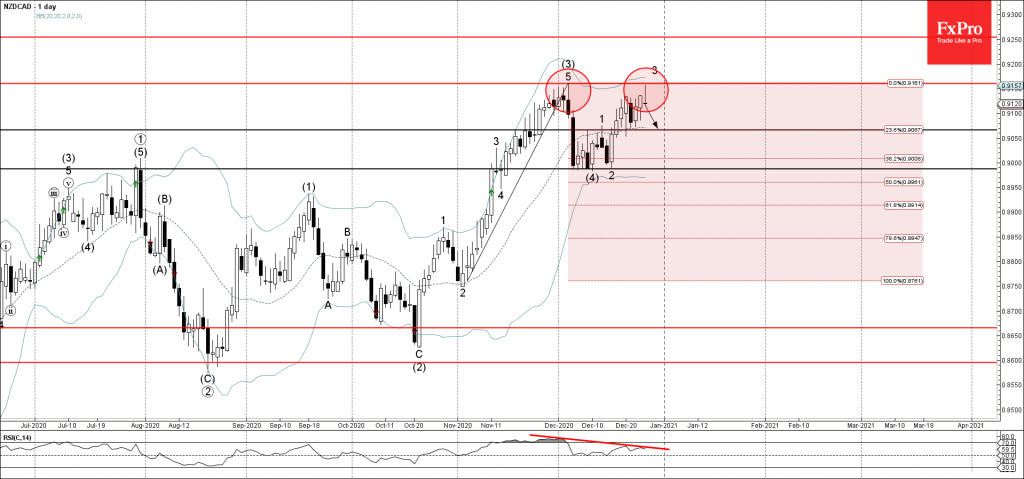
• NZDCAD reversed from key resistance level 0.9160
• Likely to fall to 0.9065
NZDCAD recently reversed down from the key resistance level 0.9160 (which stopped the sharp upward impulse wave (3) at the start of December) – strengthened by the upper daily Bollinger Band.
The downward reversal from the resistance level 0.9160 is likely to create the daily Shooting Star – if the pair closes today near the active levels.
Given the strength of the resistance level 0.9160 and the bearish divergence on the daily RSI indicator – NZDCAD is expected to fall further toward the next support level 0.9065 (former minor resistance from the start of December).
From: The FxPro Tech Analysis Team https://fxpro.news/market-snapshots/nzdcad-wave-analysis-28-december-2020-20201228/
Selected by fonecable.com

Search Web: NZDCAD Wave Analysis 28 December, 2020
Recent Posts
- Crude Oil Over Crypto
- US Dollar Price Action Setups pre-CPI: EUR/USD, GBP/USD, USD/JPY
- Cathie Wood & Ark: Insiders Aren’t Buying the Hype
- Breaking News: ECB Holds Rates, Setting up July and September for Fireworks
- Currency Carry Trade: What is it and how does it work?


Average Rating